⚠️ One or more answers suggest you should consider paper trading today. Emotional clarity is your edge.
TRADE JOURNAL
Document every trade. This is where improvement lives.
PRE-TRADE CHECKLIST
All 7 must be checked before pressing the button.
✓
⏰ Time: Between 9:30 AM and 11:00 AM EST
✓
📊 HTF Bias: Clear HH/HL or LH/LL on 15-minute chart
✓
💧 Liquidity Swept: Key high or low taken out — visible wick
✓
⚡ iFVG Present: Marked with rectangle on chart
✓
🌊 Order Flow: 1-min BOS in trade direction inside iFVG
✓
📏 Risk:Reward: At least 1:1 to next liquidity target
✓
📅 No News: No high-impact events within 15 minutes
Only trade at 4+ stars. Below that — observe only.
TRADING GLOSSARY
Hover over highlighted terms in the course to see definitions.
FVG — Fair Value Gap
A 3-candle imbalance where price moved so fast it left untested prices. Markets tend to return to fill these zones.
iFVG — Inverse Fair Value Gap
When price returns to a FVG and bounces instead of passing through — the zone flips its role. This flip is your entry signal.
BSL — Buy-Side Liquidity
Stop losses of short sellers, sitting above swing highs and equal highs. Institutions sweep these to fill their sell orders.
SSL — Sell-Side Liquidity
Stop losses of long traders, sitting below swing lows and equal lows. Institutions sweep these to fill their buy orders.
PDH / PDL
Previous Day High / Previous Day Low. Primary liquidity targets to mark every morning before 9:30 AM.
BOS — Break of Structure
Price breaks a swing high (uptrend) or swing low (downtrend), confirming the trend is continuing.
CHoCH — Change of Character
Price breaks against the current trend direction — an early warning sign that a reversal may be forming.
HTF — Higher Time Frame
Typically the 15-minute chart. Used to establish directional bias. Never trade against the HTF bias.
HH/HL — Higher High / Higher Low
The pattern that defines an uptrend. Each peak and valley is above the last. Bias = LONG.
LH/LL — Lower High / Lower Low
The pattern that defines a downtrend. Each peak and valley is below the last. Bias = SHORT.
NQ / MNQ
E-mini Nasdaq-100 Futures ($20/pt) and Micro E-mini Nasdaq ($2/pt). Always start on MNQ.
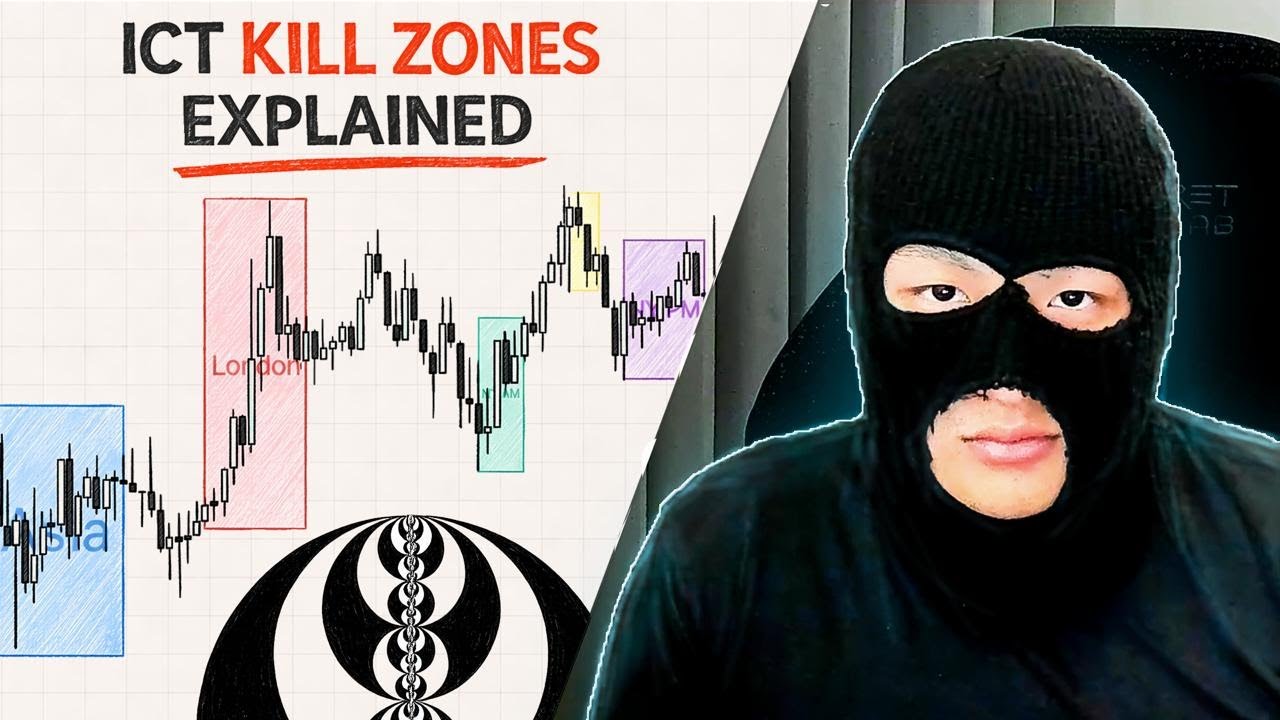
Killzone
The NY Open Killzone: 9:30–11:00 AM EST. Highest volume, sharpest moves. This is the only window we trade.
Trailing Drawdown
A drawdown limit that follows your highest profit. If you make $2,000 then lose it back, you've consumed $2,000 of allowable drawdown.
NFP / CPI / FOMC
High-impact economic events. Non-Farm Payrolls, Consumer Price Index, Federal Reserve meetings. Do not trade on these days.
1R
Your risk amount on a trade. A 1:1 trade means profit equals risk. A 2:1 trade means profit is 2× risk.
Movin Trades · Zero to Funded
MOVIN TRADES UNIVERSITY
The complete curriculum. From zero market knowledge to a funded prop firm account. One strategy, one process, mastered completely. Work through every module in order.
01 · Mental
02 · Markets
03 · Liquidity
04 · FVG & iFVG
05 · Order Flow
06 · The Strategy
07 · Risk
08 · Prop Firms
09 · Playbook
MT
1
Rookie Trader
XP PROGRESS0 / 150 XP
0
Total XP
0
Day Streak 🔥
0/9
Modules Done
0/9
Quizzes Passed
COURSE PROGRESS
0%
🎯
Next Recommended Action
Start with Module 01 — The Mental Game
Master your psychology before touching a chart.
→
📋
Daily Discipline Check-In
Start every trading session with an honest mental inventory
START CHECK-IN
Your Progress
MODULE OVERVIEW
MODULE 01Not Started
🧠
The Mental Game
Psychology, discipline, process over results
3 concepts · quiz included
MODULE 02Not Started
📈
Markets From Zero
Candlesticks, structure, sessions & killzones
4 concepts · quiz included
MODULE 03Not Started
💧
Liquidity
Where orders live, how sweeps work
2 concepts · quiz included
MODULE 04Not Started
📊
FVG & iFVG
Fair value gaps and the inverse entry
2 concepts · quiz included
MODULE 05Not Started
🌊
Order Flow
Reading momentum and the 3-TF system
2 concepts · quiz included
MODULE 06Not Started
✅
The Full Strategy
The complete 7-step model + scenarios
4 concepts · quiz + scenarios
MODULE 07Not Started
🔢
Risk & Sizing
Position sizing, drawdown, the 1% rule
2 concepts · quiz + calculator
MODULE 08Not Started
🏢
Prop Firms
How to pass an evaluation and get funded
2 concepts · quiz included
MODULE 09Not Started
📅
The Playbook
Daily routine, checklists, journal prompts
4 sections · mistakes DB
Rewards
ACHIEVEMENTS
🥇
First Step
Complete any module
🧠
Mindset Master
Complete Module 01
📈
Chart Reader
Complete Module 02
💧
Liquidity Hunter
Complete Module 03
📊
Gap Trader
Complete Module 04
🌊
Flow State
Complete Module 05
✅
The Model
Complete Module 06
🛡️
Risk Pro
Complete Module 07
🏢
Funded Ready
Complete Module 08
🏆
Full Circle
Complete all 9 modules
📝
Quiz King
Pass all 9 quizzes
📓
Journaler
Log 5 journal entries
🔥
7-Day Streak
Login 7 days in a row
Module 01 · Movin Trades
THE MENTAL GAME
Before a single chart. Before a single setup. This is where trading is won or lost. The mental module is the foundation everything else is built on.
Your mind is not designed for trading. It is designed to avoid pain. In the market, that instinct will cost you money — every single time you let it take over. Knowing this is the first step to overriding it.
🔴
RED = FEAR
When a candle goes red, your brain screams danger. It wants to exit, move the stop, do anything to avoid more pain. This is the exact moment most traders make their worst decisions.
🟢
GREEN = GREED
When a candle goes green, your brain wants more. It wants to add size, ignore the plan, stay in too long. Greed is just as dangerous as fear — it just feels better while it's happening.
🛑
Moving a Stop Loss
It is incredibly easy to move a stop loss. One click. No friction. But that one click is your brain avoiding short-term pain — and creating catastrophic long-term damage to your account.
🏆
The Best Loser Wins
90% of traders lose. Most of them are trying to avoid losses. The traders who win are the ones who have made peace with losing. They take the small loss and move on. That IS the edge.
→
You are wired to avoid pain — your brain will always look for the exit before the trade has had time to work
→
Your mind is designed to lose in the market. This isn't an insult — it's biology. Knowing this gives you the power to override it.
→
Take trades for what they are — not what you are. A losing trade doesn't make you a loser. A bad entry is data, not identity.
→
Be friends with uncertainty. The next trade could be your best trade ever or a small loss. Both outcomes are acceptable. Both are part of the game.
Pain and fear are why traders fail. Not lack of knowledge. Not lack of strategy. The trader who masters their psychology will always outperform the trader who masters their charts but ignores their mind.
⚡
Discipline — The Bridge Between Poor and Rich Traders
Mental
The Hard Truth
Technical analysis will not get you rich. Wall Street could post their exact rules to the public — and the public would still lose. Why? Because discipline is the real edge. Not the setup. The discipline to follow the setup.
1
When We Lose, We Think We Need a New Strategy
This is the single most common trap in trading. A losing week triggers a search for a new indicator, a new system, a new method. The problem is almost never the strategy. The strategy is working. The trader is not following it.
The real question after a loss: Did I follow my rules exactly? If yes — the loss is valid and expected. If no — fix the behavior, not the strategy.
2
Strategy Is the Easy Part of Trading
Anyone can learn a strategy. You can learn FVGs, liquidity, and order flow in an afternoon. The knowledge is accessible. What separates profitable traders is not knowledge — it's consistent execution of that knowledge under pressure.
The real work: Executing correctly at 9:47am when you're down 2 trades and see what looks like a perfect setup that doesn't quite meet all your criteria. That's the test. That's where most traders fail.
3
Trade Well, Not Often
More trades does not mean more money. Most of the time it means more losses. The best traders take fewer trades, but execute each one with precision and patience.
Base hits win games. You don't need a home run every session. Consistent 1:1 trades taken only when the setup is perfect compound into real results over time. One clean trade a day beats five forced ones every single week.
4
Discipline Is the Bridge Between Poor and Rich Traders
Two traders. Same strategy. One profitable. One not. The difference — every single time — is discipline. The profitable trader follows the plan when it's uncomfortable. The losing trader makes exceptions.
Wall Street could post their rules to the public and the public would still lose. Because having the rules and following the rules are two completely different things. You now have the rules. Follow them.
Trade with discipline, not emotion. Base hits win championships — not home runs.
— Movin Trades · Learn. Trade. Elevate.
🎯
Process Over Results — The Mindset Shift That Changes Everything
Mental
The Reframe
Stop asking "Did I make money today?" Start asking "Did I follow my rules today?" A rule-following losing trade IS a success. A rule-breaking winning trade IS a failure — because it reinforces the wrong behavior.
❌ Wrong Scorecard
"Did I make money today?" — This makes a rule-following losing trade feel like failure. It causes desperate, compensating behavior on the next trade. This is how one loss becomes five.
✅ Right Scorecard
"Did I follow my rules today?" — A loss that followed all rules is a success. The edge pays out over 100+ trades, not each individual one. This reframe changes everything.
Required reading: "Trading in the Zone" by Mark Douglas. Read it before you go live on a prop firm account. Then read it again after your first month funded. This book does more for your trading than any strategy ever will.
MODULE 01 COMPLETE?
Mark this module done to earn 100 XP and unlock your quiz.
Module 02 · Foundation
MARKETS FROM ZERO
If charts look like a cockpit right now — start here. This section builds the foundation everything else depends on. Every concept in the modules ahead builds on this one.
A market is an auction. Millions of buyers and sellers agree on prices in real time. More buyers than sellers → price goes UP. More sellers than buyers → price goes DOWN. Every chart, every candle, every move — is just this principle playing out.
Going LONG (Buying)
You believe price will go UP. You buy at a lower price, sell at a higher price. On NQ: each point = $20 profit (or $2 on MNQ). Simple.
Going SHORT (Selling)
You believe price will go DOWN. You sell at a higher price, buy back lower. Works exactly like going long — just in reverse direction.
Start on MNQ — always. Micro E-mini Nasdaq = 1/10th the size of NQ. Each point = $2 instead of $20. Same setups, same strategy, same concepts — but a bad trade costs 10x less. Learn here. Scale when consistently profitable.
🕯️
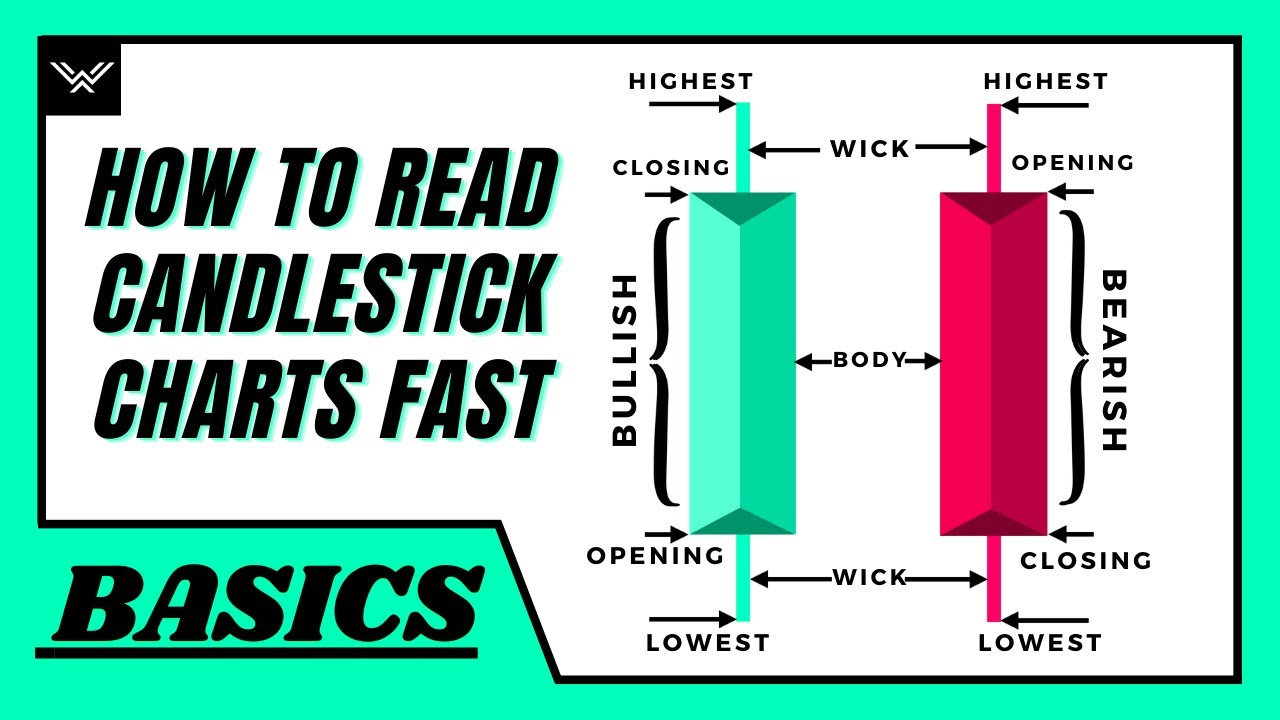
Candlesticks — Reading the Story of Price
Foundation
▲
Green (Bullish) Candle — Price went UP. Open is at the bottom of the body. Close is at the top. Wicks show the full high and low reached during that period.
▼
Red (Bearish) Candle — Price went DOWN. Open is at the top of the body. Close is at the bottom. Same wick logic as green candles.
→
Big body, tiny wicks — Strong conviction. One side dominated the entire period. Institutions were aggressive. This is energy you follow.
→
Long upper wick — Buyers pushed price up but sellers rejected it hard. Bearish signal — often a liquidity sweep above a swing high.
→
Long lower wick — Sellers pushed price down but buyers absorbed it all. Bullish signal — often a liquidity sweep below a swing low.
Practice ZoneCANDLE CHALLENGE
Look at the candle below. What is it telling you about the market? Click the best answer.
Uptrend = Higher Highs + Higher Lows (HH/HL). Each peak and each valley is above the last. Your bias = LONG. Only look for buy setups.
▼
Downtrend = Lower Highs + Lower Lows (LH/LL). Each peak and valley is below the last. Your bias = SHORT. Only look for sell setups.
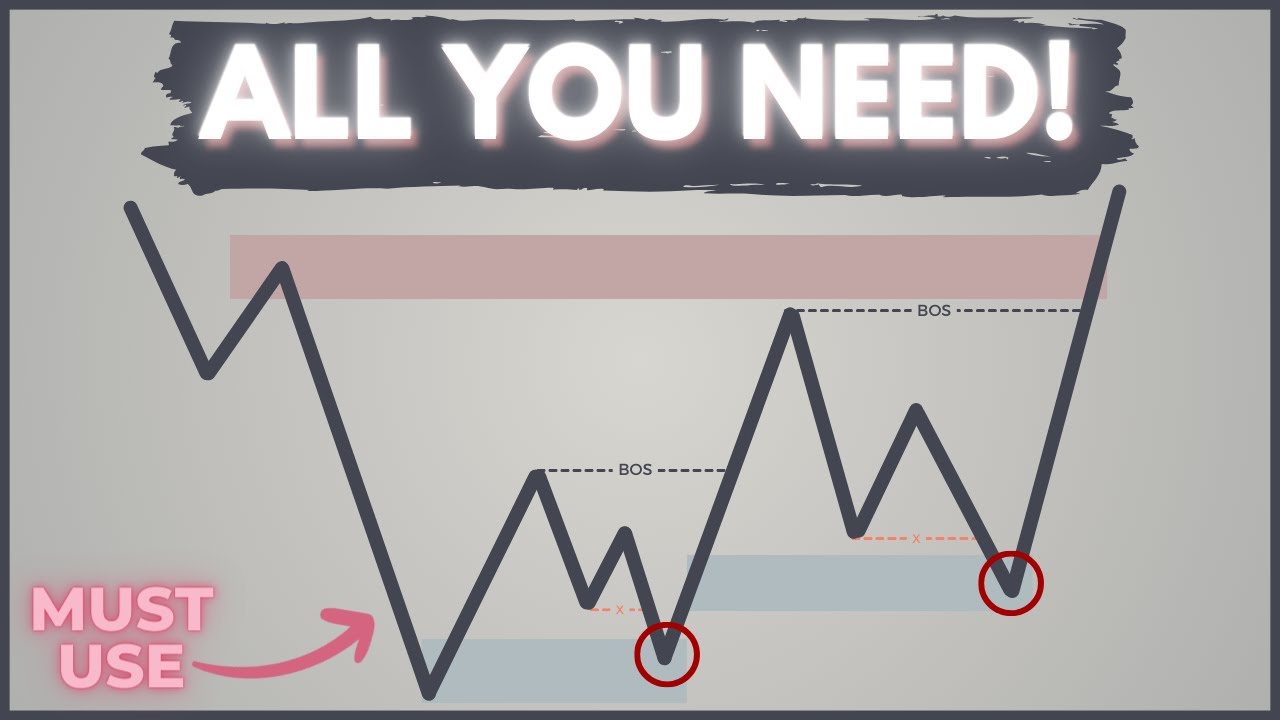
BOS
Break of Structure — Price breaks a swing high in uptrend or swing low in downtrend. Trend continuing. Stay with the bias.
CHoCH
Change of Character — Price breaks AGAINST the current trend. Early warning of reversal. Watch for a new directional bias to establish.
Practice ZoneMARK THE STRUCTURE
Click candles to mark Swing Highs (peaks) and Swing Lows (valleys). Switch modes with the buttons below. Then press CHECK to see if you got it right.
Your job before 9:30 AM: Look at the 15-min NQ chart. Is it HH/HL or LH/LL? Write "BIAS = LONG" or "SHORT." Never trade against this on session day. This one rule eliminates most losing trades.
News rule — non-negotiable: Check ForexFactory every morning before opening charts. NFP, CPI, FOMC, Fed speeches = no trading that day. These events can move NQ 100+ points in seconds and spike right through any stop loss.
MODULE 02 COMPLETE?
Mark this module done to earn 100 XP and unlock your quiz.
Module 03 · ICT Core
LIQUIDITY THE SECRET
This is the concept that changes how you see the market forever. Once you understand where liquidity lives, you stop chasing breakouts and start trading the hunts.
Liquidity is where orders are sitting in the market, waiting to be triggered. Large institutions — hedge funds, banks, central banks — need to execute orders worth hundreds of millions. They cannot simply "click buy." The market doesn't have enough opposing orders at one price to fill their entire position. So they engineer price to move toward clusters of stop losses first — triggering those orders — then reverse in the true direction.
⬆️
Buy-Side Liquidity (BSL)
Above Highs
Sits ABOVE swing highs and equal highs. These are the stop losses of short sellers. When price sweeps above a high, those stops trigger as buy orders — which institutions then sell into at premium prices. You'll see a wick above the high.
⬇️
Sell-Side Liquidity (SSL)
Below Lows
Sits BELOW swing lows and equal lows. These are the stop losses of long traders. When price sweeps below a low, those stops trigger as sell orders — which institutions buy into at discounted prices. You'll see a wick below the low.
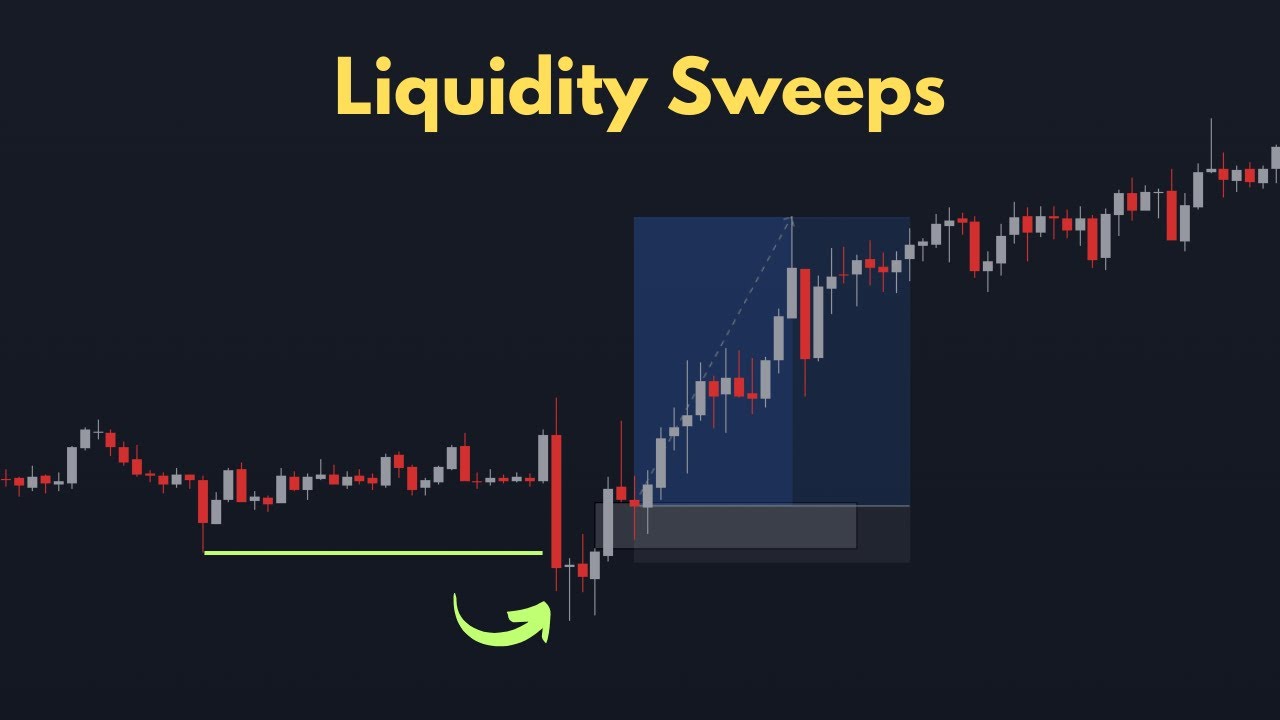
🎣
The Liquidity Sweep — Reading the Hunt
ICT Core
Key Insight
A sweep happens when price briefly pierces a key high or low, triggers the stops, then immediately reverses. On a candle chart you see a long wick — the candle pokes through the level then closes back on the other side. This is NOT a failed breakout. This is an intentional institutional order collection.
1
Price approaches a key level
The level has visible equal highs, a PDH/PDL, or a clear swing point. Retail traders have stacked stops here — this is the target. You should have this level already marked on your chart from your pre-market prep.
Mark every morning: PDH, PDL, Asian session high/low, visible equal highs/lows on the 15m chart.
2
Price spikes through — the sweep
A wick forms above the high (or below the low). The candle body closes BACK INSIDE the range. Retail traders just got stopped out. Their stops became the orders institutions needed.
This wick is your signal. The hunt is completing. Your attention should sharpen here.
3
Price reverses sharply — the real move
After collecting the stops, price reverses hard in the opposite direction. This is where the real institutional position is being deployed. The sweep was just the preparation.
Bigger level swept = more powerful reversal that follows. PDH/PDL sweeps produce the most reliable setups in this strategy.
①
Previous Day High (PDH) and Low (PDL) — Primary targets. Mark before 9:30 AM. Price sweeps one on most NY sessions.
②
Asian Session High and Low — Overnight range. Frequently swept at NY open before the real move begins.
③
Equal Highs / Equal Lows — Two or more touches of the same level = massive stop cluster. The more touches, the stronger the magnetic pull.
④
Visible Swing Highs and Lows on 15m — Active structural points from the last 24–48 hours. Live liquidity targets.
"Price goes to liquidity. Always ask: where are the stops? That's where price is going next."
— Movin Trades Core Principle
MODULE 03 COMPLETE?
Mark this module done to earn 100 XP and unlock your quiz.
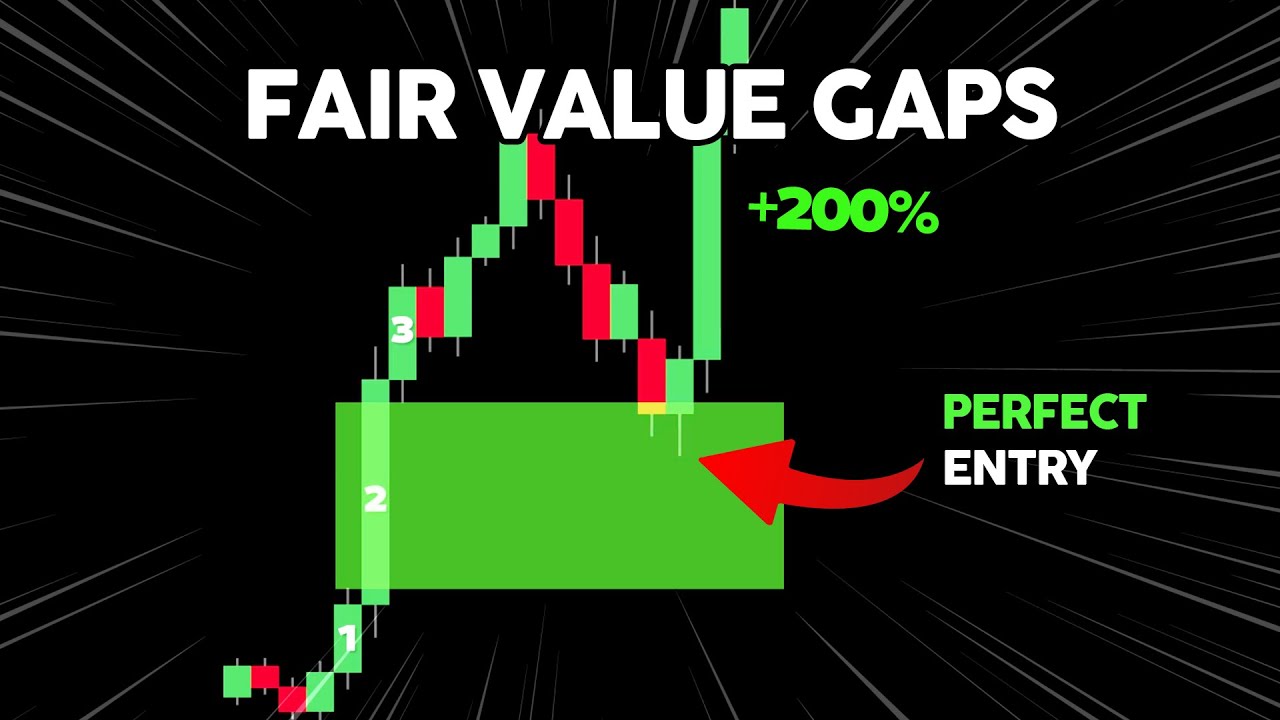
Module 04 · ICT Core
FVG & iFVG
Liquidity tells you WHERE price is going. The iFVG tells you exactly HOW to get in — with a precise entry, a tight stop, and a defined target.
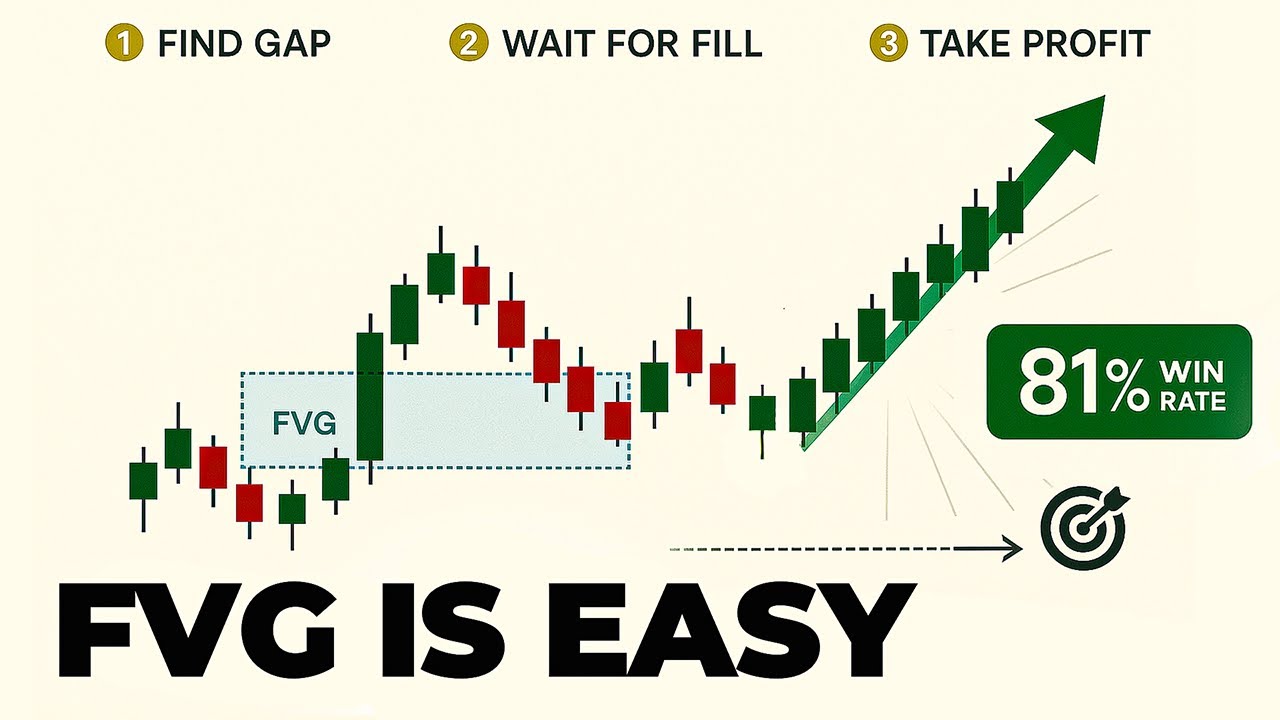
A Fair Value Gap is a 3-candle pattern where price moved so fast it skipped an entire price zone — leaving a gap of untested prices. Candle 1's HIGH is below Candle 3's LOW (bullish FVG). The zone between them is the FVG. Markets tend to return to fill these imbalances because institutional algorithms are programmed to seek price efficiency.
⬆️
Bullish FVG
Support Zone
Created by a fast upward 3-candle move. The gap sits BELOW current price. When price returns to it, it often acts as support. This is where we look for LONG entries when the flip happens (iFVG).
⬇️
Bearish FVG
Resistance Zone
Created by a fast downward 3-candle move. The gap sits ABOVE current price. When price returns to it, it often acts as resistance. This is where we look for SHORT entries when the flip happens (iFVG).
How to mark a FVG on your chart: In TradeSea — Drawing Tools (left toolbar) → Rectangle → drag from Candle 1's high to Candle 3's low. That box is now your active FVG zone. Leave it on the chart until price fills it or it invalidates.
An iFVG occurs when price returns to a previously created FVG and instead of passing through it — it BOUNCES. The old FVG flips its role: a bearish FVG becomes support, a bullish FVG becomes resistance. This flip is your entry. Your stop goes just outside the zone. Your target is the next liquidity pool.
1
A FVG forms during the liquidity sweep move
Price sweeps a key level. During that fast move, a 3-candle FVG is created. Mark it immediately with a rectangle. This zone is now active and on your radar.
Only mark FVGs created during or immediately after a liquidity sweep. These are Grade A. Random FVGs in the middle of a range are low probability — skip them.
2
Price reverses after the sweep
The liquidity hunt completes. Price begins moving in the opposite direction — retracing back toward your marked FVG zone. Watch it approach. Your finger is NOT on the trigger yet.
3
Price enters the FVG zone — watch for the flip
As price enters the old FVG, watch for rejection. A bearish FVG holding as support = the iFVG is active. Drop to the 1-minute chart now.
You need to see price show reaction at the zone — not just touch it. Look for wicks forming, momentum slowing, or a small BOS forming on the 1-min.
4
1-min BOS confirms — pull the trigger
A 1-min candle closes in your direction forming a clear Break of Structure inside the iFVG zone. This is your signal. Press B (long) or S (short) in TradeSea Scalp Mode. Stop goes just below the iFVG low (for longs). Target = next liquidity pool.
This is the complete trade. Every module has been building to this moment.
Invalid setup signals: Price closes a full candle THROUGH the iFVG without bouncing | 15m HTF bias opposes the trade | Time is after 11:00 AM | Major news within 15 minutes | iFVG was previously tested and failed to hold
MODULE 04 COMPLETE?
Mark this module done to earn 100 XP and unlock your quiz.
Module 05 · Confirmation
ORDER FLOW
The iFVG shows you where to look. Order flow tells you when the timing is right. It's your confirmation layer — the difference between anticipating a move and entering with evidence.
Each pullback makes a Higher Low — buyers defending
→
Bullish candles consistently bigger than the bearish ones
→
1-min BOS upward while price sits in the iFVG zone
🔴
Bearish Order Flow
Short Signal
→
Strong red candles with tiny or no upper wicks
→
Each bounce makes a Lower High — sellers capping
→
Bearish candles consistently bigger than the bullish ones
→
1-min BOS downward while price sits in the iFVG zone
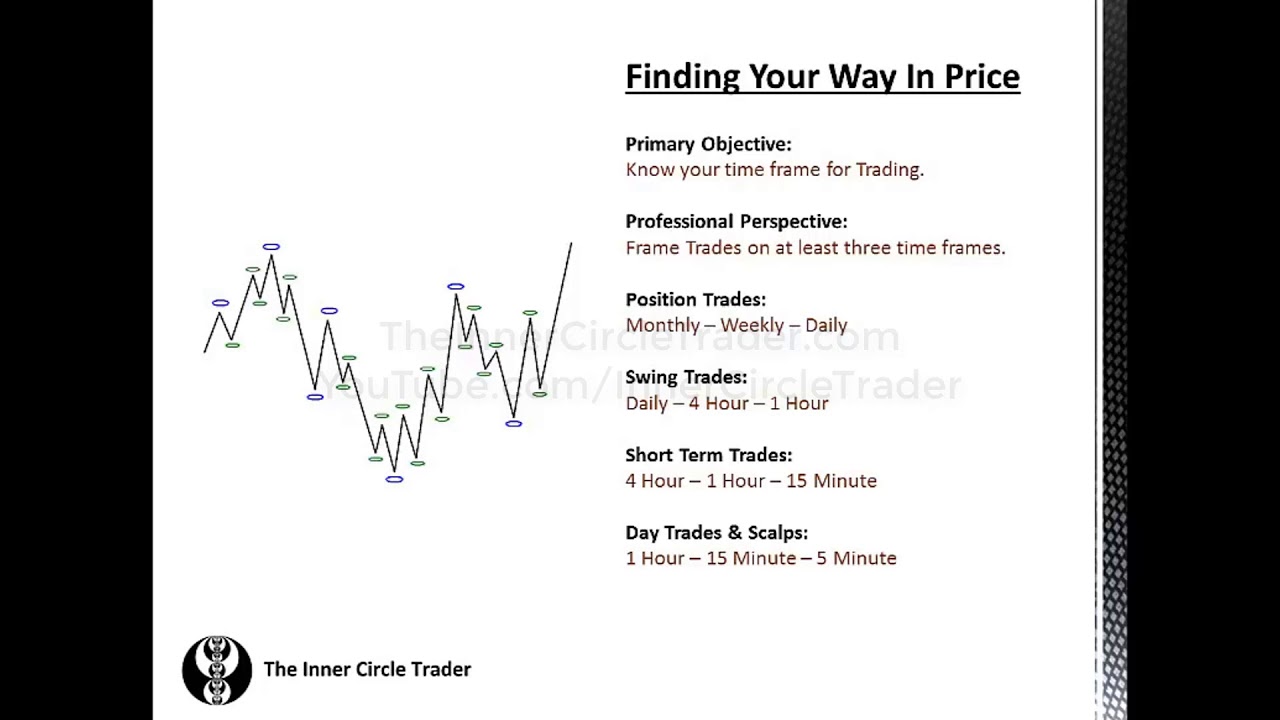
📐
The Three-Timeframe System
Confirmation
15-Minute — HTF Bias
Directional bias for the session. Bullish or bearish structure? This is your north star for the entire trading day. Never trade against it. No exceptions.
5-Minute — The Setup
Watch the retracement forming. Confirm price is approaching your marked iFVG zone. This timeframe shows you the setup is developing as expected before you zoom in.
1-Minute — The Entry
The BOS on the 1-min while price is inside the iFVG = your trigger. This is the only timeframe used to execute the actual trade entry. All other timeframes set the context.
The hardest discipline in this strategy: When the 15m is bullish but you see a perfect-looking short on the 1m — skip it. Higher timeframe bias wins every single time without exception. If you break this rule consistently, you will lose money consistently.
MODULE 05 COMPLETE?
Mark this module done to earn 100 XP and unlock your quiz.
Module 06 · The Model
THE FULL STRATEGY
Every element — mental game, structure, liquidity, FVG, order flow — combined into one repeatable process. Every trade follows this sequence. No exceptions. No improvisations.
ForexFactory.com → filter for red events. If NFP, CPI, or FOMC is today, decide now whether you're trading. This decision is made before charts are opened — not at 9:28 when you're excited about a setup.
9:00
Mark PDH, PDL, and Overnight Range
Draw horizontal lines on the 15-min chart: Previous Day High, Previous Day Low, Asian session high and low. These are your primary liquidity targets — price will likely sweep one of them today.
In TradeSea: Drawing Tools → Horizontal Line → click at each level. Label them with the Text tool so you know what each line represents.
9:10
Determine HTF Bias and Write It Down
15-min chart: HH/HL = LONG bias. LH/LL = SHORT bias. Check ALMA and McGinley indicators for confirmation. Write it on paper or a note: "BIAS = LONG / SHORT. Targets: PDH at [X] / PDL at [Y]."
Writing it makes it real. It commits you to the bias before price moves and before your emotions can override it.
9:25
Stop Drawing — Observe
Let the NY open happen for 3–5 minutes before reacting. Watch the initial direction. The market will show you its hand. The setups that form in the first 2 minutes of the open are often fake — let the algos settle.
✅
The Trade Checklist — All 7 Required
Entry Rules
✓
⏰ Time: Between 9:30 AM and 11:00 AM EST only
✓
📊 HTF Bias: 15-min shows clear HH/HL or LH/LL structure
✓
💧 Liquidity Swept: A key high or low was taken out — visible wick through level
✓
⚡ iFVG Present: Clear FVG in the retracement zone — already marked with rectangle
✓
🌊 Order Flow: 1-min BOS in trade direction as price touches the iFVG
✓
📏 Risk:Reward: Stop placement gives at least 1:1 to the next visible liquidity target
✓
📅 No News: No high-impact events within the next 15 minutes
All 7 must be checked. If even ONE is missing — there is no trade. This is not a suggestion. This IS the strategy. Every time you bypass this checklist, you are trading without an edge.
🎯
Entry · Stop · Target
Execution
Entry
Enter on the 1-min BOS candle close while price is inside the iFVG zone. Press B (long) or S (short) in TradeSea Scalp Mode. Make sure lot size is set correctly before entering.
Stop Loss
A few ticks below the iFVG low (longs) or above the iFVG high (shorts). Place within 5 seconds of entry — no exceptions. If price fully closes through the zone after entry → exit immediately.
Take Profit
Target the next liquidity pool: PDH, PDL, or equal highs/lows. Take 50% at 1:1. Move stop to breakeven. Let remainder run to the full liquidity target above/below.
Do not move your stop further from entry. Ever. If price is heading toward your stop — let it stop you out. Small losses are part of the 80%+ win rate equation. Moving stops turns small losses into account-ending losses. One rule. Absolute.
Real Examples
TRADE REVIEWS
WINNING TRADE
PDL Sweep → Bullish iFVG → Long
SetupPDL swept at 9:38 AM with a sharp wick down. Bullish FVG formed during the sweep move. Price retraced into the FVG. 1-min BOS upward confirmed at 9:41 AM.
ResultPrice reversed and stopped out at 18,498. Loss of 12 pts = -1R. Stop was NOT moved.
✅ RightAll 7 rules confirmed. Stop placed immediately after entry and left alone. Loss accepted cleanly.
📚 LessonThis is a valid loss. An 80% win rate means 1 in 5 trades fails. This was that 1. The process was correct. Move on.
Practice
WHAT WOULD YOU DO?
SCENARIO 01
It's 9:47 AM. The 15-min chart is in a clear uptrend (HH/HL). Price just swept the Previous Day Low with a sharp wick down. During the sweep, a bullish FVG formed on the 5-minute. Price is now retracing up into that FVG. A 1-minute candle just closed GREEN forming a BOS upward inside the FVG zone. No high-impact news today.
What do you do?
SCENARIO 02
It's 10:15 AM. The 15-min shows LH/LL (downtrend). Price swept the Asian session high with a wick upward and has started falling. A bearish iFVG is forming and price is approaching it. Your stop placement would give you 0.8:1 risk:reward (not quite 1:1). CPI data releases at 10:30 AM.
You see a short setup forming. What do you do?
MODULE 06 COMPLETE?
Mark this module done to earn 100 XP and unlock your quiz.
Module 07 · Risk Management
RISK & SIZING
The best strategy in the world loses to poor risk management. This module is what keeps you in the game long enough for the edge to pay out consistently over time.
🔢
Position Sizing — The Math That Keeps You Alive
Risk
The 1% Rule
Never risk more than 1% of your account on a single trade. At 1% risk per trade with an 80%+ win rate, it is mathematically near-impossible to blow a funded account. Formula: Dollar Risk ÷ (Stop Loss in Points × Point Value) = Max Contracts.
Position Size Calculator
$500
Dollar Risk
3
Max Contracts
$500
Profit at 1:1
$1,000
Profit at 2:1
Account
Firm Daily Limit
Your Personal Limit
Trades Before Limit
$25,000
$1,250 (5%)
$500 (2%)
5 losses at 1% risk
$50,000
$2,500 (5%)
$1,000 (2%)
5 losses at 1% risk
$100,000
$5,000 (5%)
$2,000 (2%)
5 losses at 1% risk
Set this now in TradeSea: Settings → Risk Settings → Daily Loss & Profit Limits. This locks the platform automatically when you hit your limit. It removes the option to override yourself in a moment of frustration.
📉
Drawdown Protocol — Surviving the Hard Times
Risk
2❌
After 2 consecutive losses — Review. Open your journal. Were all 7 checklist items present? Be honest. If yes = variance, keep going. If no = you deviated. Fix the behavior.
3❌
After 3 consecutive losses — Rest day. Do not trade the following day. Review all 3 trades. Give your brain a reset. A rest day is an investment in the next week's performance.
⛔
After hitting daily loss limit — Platform closed. Not minimized. Not watching. Closed. The session is completely over. What you do in the hour after a limit day shows your real discipline level.
🚫
Never increase size to "make it back." Revenge trading is the single fastest path to a blown account. The position sizing rules never change based on recent results. Never.
"The goal of a losing trade is to lose well — take the small loss, reset, and come back with a clear mind."
— Mark Douglas · Trading in the Zone
MODULE 07 COMPLETE?
Mark this module done to earn 100 XP and unlock your quiz.
Module 08 · Getting Funded
PROP FIRMS
Trade with institutional capital. Keep 80–90% of profits. The evaluation is not a profit competition — it is a risk management test. Pass it by not failing it.
Straightforward evaluation with no trailing drawdown risk
4
My Funded Futures
80–90%
Fixed drawdown limit
Futures-focused, competitive account sizes and scaling
5
Apex Trader Funding
90%
Trailing from peak
NQ/MNQ futures — understand trailing drawdown before buying
Trailing drawdown warning: With trailing drawdown firms (like Apex), your drawdown limit trails your highest profit point. If you make $2,000 then lose it all back, you've consumed $2,000 of drawdown room. Understand this before you buy. Protect early profits aggressively.
Your only goal for the first 3 days is zero violations. Get comfortable with the account rules. Understand the drawdown mechanics. Small profits are fine. Surviving these days intact IS winning.
The evaluation is a risk management test — not a profit maximization contest. The firms want to see that you won't blow up. Prove it by not blowing up.
D4+
Normal sizing if P&L is positive
You have a cushion now. A normal bad day cannot threaten the evaluation. Trade your standard size with confidence. Stay consistent with the process that got you to this point.
Near Target
Reduce to 50% size
If you need 2% more profit to pass — cut position size in half. A smaller profit still passes. The fee you paid and the work you've done are now protected. Don't reach for max profit here.
Tiny win = evaluation passed. Greed at the finish line = evaluation failed. Protect what you've built.
Bad Day
Stop at your 2.5% personal limit
Not "one more to recover it." Close the platform. The evaluation is still there tomorrow. Evaluations are failed one revenge trade at a time — not one bad setup at a time.
#1 reason evaluations fail: Hitting the daily drawdown limit on one bad day from revenge trading after an initial loss. Not bad setups. Not bad strategy. Emotional response to the first loss of the day. The psychology module is not separate from this module — it IS this module.
MODULE 08 COMPLETE?
Mark this module done to earn 100 XP and unlock your quiz.
Module 09 · Your Playbook
THE PLAYBOOK
Everything in one place. Your daily schedule, master checklists, resources, and next steps. This is the page you come back to every morning.
📅
The Daily Schedule
Routine
Time (EST)
Activity
Why
7:00 AM
Wake. No screens for 30 min. Water, food.
Cortisol peaks at wake. Let it settle before market stress.
8:30 AM
Economic calendar — ForexFactory.com
Flag all red events. Decide if you're trading today.
8:45 AM
Mark PDH, PDL, Asian range. Determine bias.
Pre-market prep complete before price starts moving.
9:25 AM
Read trading rules. 5 slow breaths.
Prime your mind for disciplined execution.
9:30 AM
Session opens — watch 3–5 mins first
Let the open print. See initial direction. Don't react.
9:35 – 11:00 AM
Active trading — setup only, no forcing
Your edge window. Execute the process or observe.
11:00 AM
Close the platform — not minimize, CLOSE
Protect morning results. Lunch chop destroys discipline.
11:30 AM
Journal every trade and every pass
Without data you make the same mistakes forever.
✅
Master Daily Checklist
Routine
✓
I checked the economic calendar before opening charts
✓
I marked PDH, PDL, and the Asian range on my 15m chart
✓
I wrote down my HTF bias before 9:30 AM
✓
I only traded between 9:30 AM and 11:00 AM
✓
All 7 trade checklist items were present on every trade I took
✓
I did not move my stop loss further from entry on any trade
✓
I did not revenge trade after any loss
✓
I closed the platform at 11:00 AM and did not reopen during lunch
✓
I journaled my trades (and any passes) after the session
🔗
Resources & Next Steps
Keep Going
🌐
InnerCircleTrader.net
100+ free ICT tutorials. The official source material for every concept in this curriculum.
Live community on Whop. Real setups shared daily. Accountability partners. Post your charts, get feedback, stay consistent. The fastest way to improve is alongside other traders working the same process.
"The trader who makes it is not the one with the best strategy. It's the one who keeps showing up, follows the rules, loses well, and improves — until the edge compounds into real wealth."
— Movin Trades · Learn. Trade. Elevate.
Self-Improvement
COMMON MISTAKES
⚠️Moving my stop loss further from entry▼
This is the fastest way to turn a small, manageable loss into an account-threatening one. Your brain rationalizes it as "giving the trade more room" — but it is simply avoiding pain at a larger cost.
✅ Fix: Pre-set your stop before entry and physically step back from the keyboard. Ask: "Would I enter this trade with this stop placement?" If yes, it stays. Non-negotiable.
🕛Trading during NY Lunch (11 AM – 1 PM)▼
Volume drops, spreads widen, and the market chops with no real direction. Any "setup" you see in this window is noise. The losses here are not strategy losses — they are discipline losses.
✅ Fix: Set a phone alarm at 11:00 AM that says "CLOSE PLATFORM." Close it. Not minimize — close. This is a rule with no exceptions.
📋Taking a trade without all 7 checklist items▼
Every checklist exception feels justified in the moment. "6 of 7 is basically all 7." It is not. Each item exists because it matters. Removing one removes a layer of edge.
✅ Fix: Open the Entry Checklist tool (✅ button, bottom right) before every trade. If you can't click all 7, there is no trade — only observation.
😤Revenge trading after a loss▼
Revenge trading is emotion pretending to be strategy. The next trade is taken to "get it back" — not because the setup confirms. This is how one -1R becomes -5R in a single session.
✅ Fix: After any loss, open your trade journal (📓 button) and write one sentence before looking at the chart again. This 60-second pause breaks the revenge cycle.
🔄Switching strategies after a losing week▼
The strategy is not broken. Review the trades honestly: Were all 7 rules present? Did you follow them exactly? In 90% of cases, the strategy performed correctly and the trader did not.
✅ Fix: Before changing anything, review your last 10 trades against the checklist. If rules were followed = variance, not failure. Fix behavior, not the strategy.
📰Trading on high-impact news days▼
NFP, CPI, and FOMC can move NQ 100+ points in seconds with no setup, no pattern, and no warning. Any stop can be spiked through instantly. This is not a risk worth taking.
✅ Fix: Check ForexFactory before opening charts. Add NFP/CPI/FOMC dates to your calendar with a "NO TRADE" block. The decision is made the night before — not at 9:29 AM.
💰Not taking 50% at 1:1 and moving stop to breakeven▼
Greed. The trade is winning and your brain wants more. So you hold through the 1:1 level hoping for a bigger move — then price reverses and you give it all back or stop out at a loss.
✅ Fix: This is a mechanical action that must happen automatically. Set a price alert or bracket order at your 1:1 level before entry so the decision is already made.
📊Overtrading — taking 5+ trades per session▼
More trades does not mean more money. After 2–3 trades, your decision quality degrades. Trades 4 and 5 are usually forced setups taken out of boredom or to justify being at the desk.
✅ Fix: Set a hard limit of 2 trades per session. After 2 trades — win or lose — close the platform. One clean trade beats five forced ones every single week.
Self-Reflection
JOURNAL PROMPTS
📈
After a winning trade
"What did I do correctly? Did I follow all 7 rules? How did I manage the trade after entry?"
📉
After a losing trade
"Were all 7 rules present? Did I follow them exactly? What emotion was I feeling before entry?"
🤔
After a skipped setup
"Why did I skip it? Was it discipline or hesitation? If it played out — what would I do differently?"
📅
End of week review
"What was my strongest trade this week? What mistake did I repeat? What is my focus for next week?"
COURSE COMPLETE?
Mark the Playbook complete to earn 100 XP and finish your Zero to Funded journey.